Why the shipping space is full in May?
Recently, many people have been asking why there has been a sudden surge in congestion and price increases?
It’s understandable to be confused, as May is not typically a peak season. So why the sudden congestion? Is this a temporary bubble, or is it an early arrival of a peak season supported by actual cargo volumes? In the markets with the most significant price increases, such as the European and U.S. shipping routes, some freight forwarders are already exclaiming that we might be heading back to the “dark days” of the pandemic.
What Exactly Happened with the U.S. Shipping Route?
Where Did This Sudden Surge in Prices Come From?
How Long Will It Last?
To answer these questions, we need to look at the fundamentals: the supply and demand relationship. The data for January to April (arrival dates) of the top 20 imports to the U.S. from Asia shows significant trends.
Data Overview:
- Overall Increase: In the first four months of this year, total imports from Asia to the U.S. increased by 14% year-over-year and by 15% compared to the same period in 2019.
- April Slowdown: While the growth momentum slowed slightly in April, with a year-over-year increase of 4%, there was still a substantial 16% increase compared to April 2019.

In specific categories, furniture and home goods showed significant year-over-year growth. Comparatively, plastic products, electrical appliances, and auto parts saw rapid increases, while rubber products and toys also performed well. Although clothing had a slight year-over-year increase, it experienced a double-digit decline compared to 2019.
How can we explain the double-digit growth in volume?
One reasonable possibility is restocking. Comparing the U.S. retail inventory-to-sales ratio from February this year with the same period in 2019, we can see that the current inventory-to-sales ratio is lower than in 2019, both for the entire retail industry and specific categories.
Besides the regular restocking operations, another “unconventional” factor is supporting the current volume: regional geopolitical instability and uncertainties related to the U.S. election have prompted customers to increase their safety stock and arrange early shipments.
Regarding the volume growth, one point that may need special mention is that traditional trade goods are the main drivers of this trend, but the most “affected” are e-commerce goods. What does this mean? We’ll set this aside for now and revisit the topic later.

From the above data, it can be seen that the increase in cargo volume is real, although not necessarily felt by every company. In theory, double-digit cargo growth should be offset by the continuous increase in new capacity, preventing a situation of tight capacity and soaring freight rates. This is perhaps the most puzzling aspect for many.
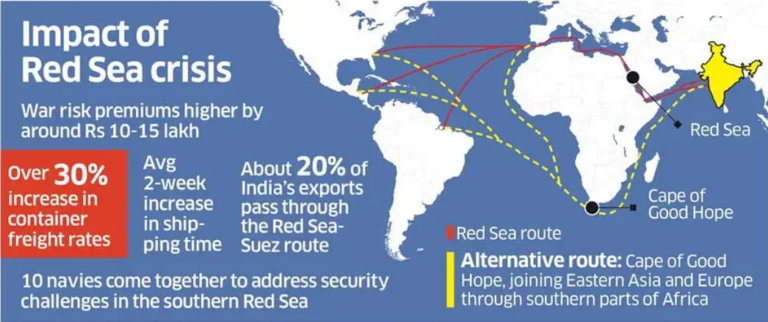
Since last year, the industry has generally accepted that the basic trend for 2024 is still one of oversupply. When the Red Sea crisis erupted at the end of last year, the conclusions drawn by various analytical institutions were the same: the new capacity coming online just filled the extra capacity needed for rerouting, balancing supply and demand. Once the Red Sea crisis is resolved, the released capacity will again lead to an oversupply situation.
It’s clear that customers are happy to accept this theory. Judging from this year’s contract rates on the trans-Pacific route, shipping companies have also accepted this inference.
In its journal on April 29th, the capacity analysis firm LINERLYTICA presented new data challenging the aforementioned speculations. By the end of June this year, global container capacity is expected to reach 30 million TEUs. By the end of May, the capacity for rerouting around South Africa is estimated to reach a staggering 5 million TEUs, accounting for nearly 17% of global capacity. With the worsening and broadening of regional tensions, this proportion is expected to continue rising.
Although nominal capacity has increased by 10% this year, on the four most critical east-west routes (Asia to Europe base, Asia to the Mediterranean, Asia to the US West Coast, and Asia to the US East Coast), the actual capacity increase due to rerouting effects is only a mere 3%. Across 33 regional routes globally, actual capacity has decreased by 4% year-on-year.
Let’s look at two more pieces of data. According to LINERLYTICA’s estimation, the global port congestion in week 18 has already approached 2 million TEUs, accounting for 6.3% of total capacity. Are shipping companies deliberately causing capacity shortages by canceling sailings? So far, only 0.3% of global capacity is idle.

In conclusion, it can be said that we all have underestimated the impact of rerouting on capacity. If shipping were an equation, with variables changing each year, experts wouldn’t always provide the correct solution. Summing up the current market situation in one sentence: a 3% actual capacity increase is met with double-digit growth due to inventory replenishment, resulting in a reversal of the supply-demand relationship.
Why isn’t this round of capacity shortage and price hikes being accepted and understood?
It’s not like everyone applauds price hikes every time; which customer likes price hikes? There are a few reasons. Firstly, the timing; traditionally, May is the off-season, so it’s hard to understand why there’s suddenly a shortage of space and soaring freight rates this year. Secondly, people’s perceptions differ. While traditional large-scale goods dominate the trans-Pacific route, e-commerce customers constitute the majority of social media traffic, yet e-commerce volumes haven’t shown much improvement, and social media is flooded with videos promoting various “deals.” Thirdly, this round of price hikes is hitting the e-commerce sector the hardest.
The most pressing question on everyone’s mind right now is: How long can this round of price hikes be sustained?
It still comes down to the two most important variables supporting freight rates: supply and demand. Looking at capacity, the scale of rerouting may continue to expand, offsetting the weakening effect of capacity reactions. In terms of demand, this year’s inventory replenishment is a return to normal after the abnormal destocking period, and it’s just getting started. Recently, the American Retail Federation raised its third-quarter volume growth forecast for this year, expecting high single-digit year-on-year growth to continue until September. On one side, effective capacity is gradually being reduced, while on the other, healthy volume growth is forecasted. Historically, almost every wave of price hikes hasn’t happened overnight but rather accumulates through the continuous change of multiple variables until the moment of triggering a qualitative change. Similarly, eliminating these factors won’t happen overnight either unless a super-major variable emerges in the market.


