Review and Inventory of US Shipping Data in March
In March 2024, US container imports increased by 0.4% compared to February, indicating a continued recovery in trade imports, with a 15.7% growth compared to the same period in 2023.
Compared to February 2024, imports also continued to decline due to the impact of the Chinese Lunar New Year. Import volumes at the Port of Los Angeles, the largest throughput port, have declined for the second consecutive month. However, the drought in Panama and ongoing conflicts in the Middle East have not yet affected ports along the East Coast and the Gulf of Mexico, leading to further improvements in port transit delays.
PART1 – US LINE DATA FOR MARCH 2024
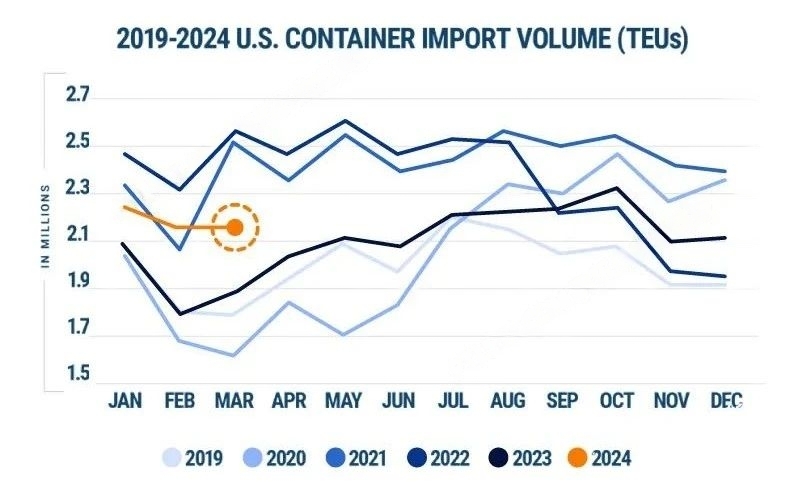
In March 2024, the container import volume to the United States increased by 0.4% compared to February,reaching 2,145,341 TEUs (see chart above). However, compared to March 2023, the number of standard containers increased by 15.7%, and by 20.6% compared to March 2019 before the COVID-19, indicating a continued strong year-on-year performance. Without the Chinese New Year effect, the growth might have been even more significant.

Over the past seven years, data for February and March 2024 show relatively stable cargo volumes, maintaining a total volume that remains largely unchanged.
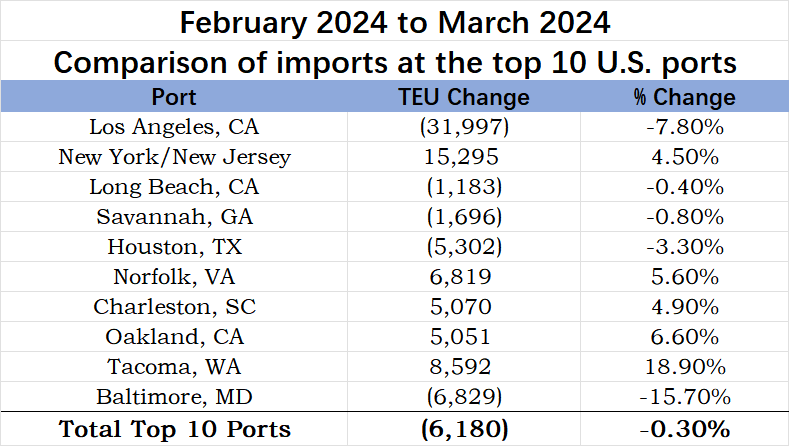
Regarding the top ten ports in the United States, container import volumes in March 2024 decreased slightly by 6,180 TEUs (-0.3%) compared to February 2024 (see chart above). The ports of New York/New Jersey (15,295 TEUs), Norfolk (6,819 TEUs), and Tacoma (8,592 TEUs) experienced the largest increases in container throughput compared to February. Los Angeles (-31,997 TEUs) and Baltimore (-6,829 TEUs), however, experienced the most significant declines, with Baltimore showing the largest decrease (-15.7%), partly due to the collapse of the Francis Scott Key Bridge at the end of March. This marks the second consecutive month of Los Angeles experiencing a monthly decline of around 30,000 TEUs.
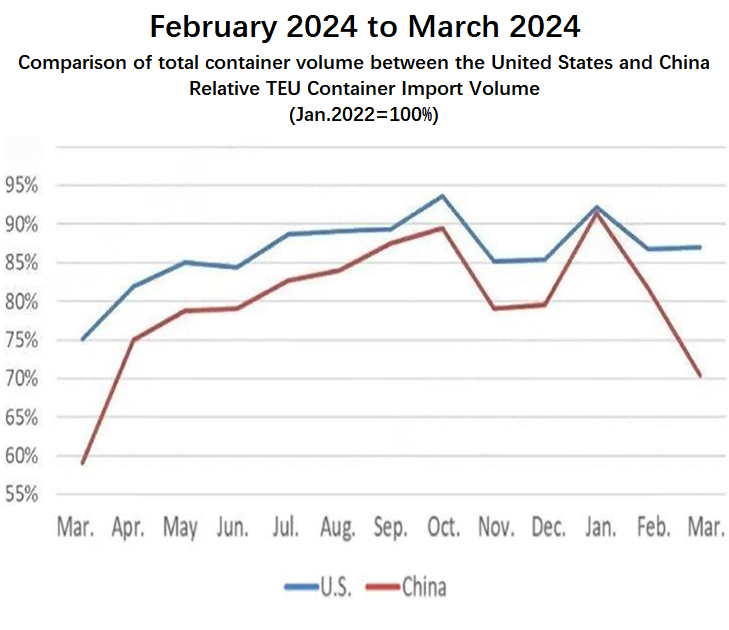
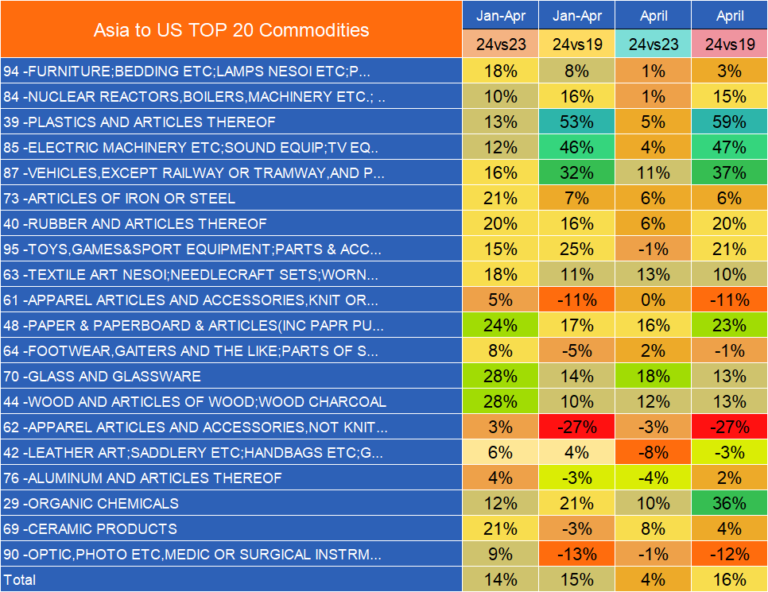
China’s imports to the United States have decreased for the second consecutive month, dropping by 13.8% in March 2024 compared to February, totaling 697,375 TEUs. Compared to the peak in August 2022 (1,003,725 TEUs), this represents a decrease of 30.5% (see chart above). Despite a slowdown in growth from February to March, the top two HS-2 commodity codes are still consumer-oriented goods, such as HS-94 (furniture, bedding, etc.) and HS-39 (plastics and articles thereof). In March, China accounted for 32.5% of total container imports to the United States, a decrease of 5.0% from February and a significant decrease of 9.0% from the peak of 41.5% in February 2022. This data is alarming, and it remains to be seen how much of this decrease can be attributed to the Chinese New Year. We will continue to monitor the data for April.
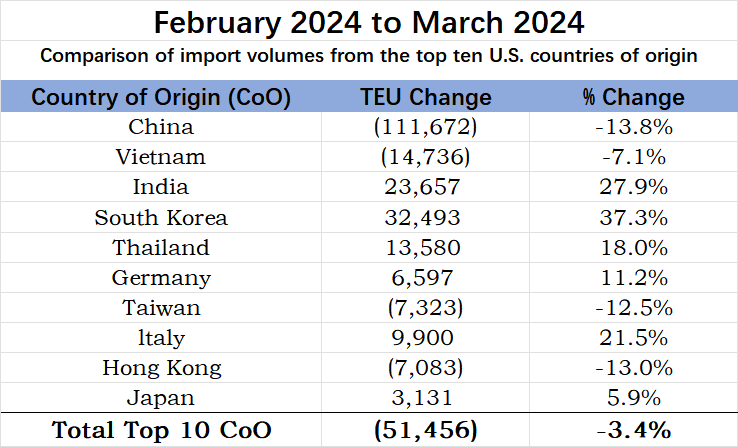
Regarding the top 10 countries of origin (CoO), container imports to the United States decreased by 51,456 TEUs in March 2024, a decrease of 3.4% compared to February. Imports from China (-111,672 TEUs) saw the largest decrease, while imports from India (23,657 TEUs) and South Korea (32,493 TEUs) saw the largest increases (see chart above).
PART2 – EAST COAST AND GULF COAST PORTS MAINTAIN LEAD, WHILE LOS ANGELES PORT CONTINUES TO DECLINE
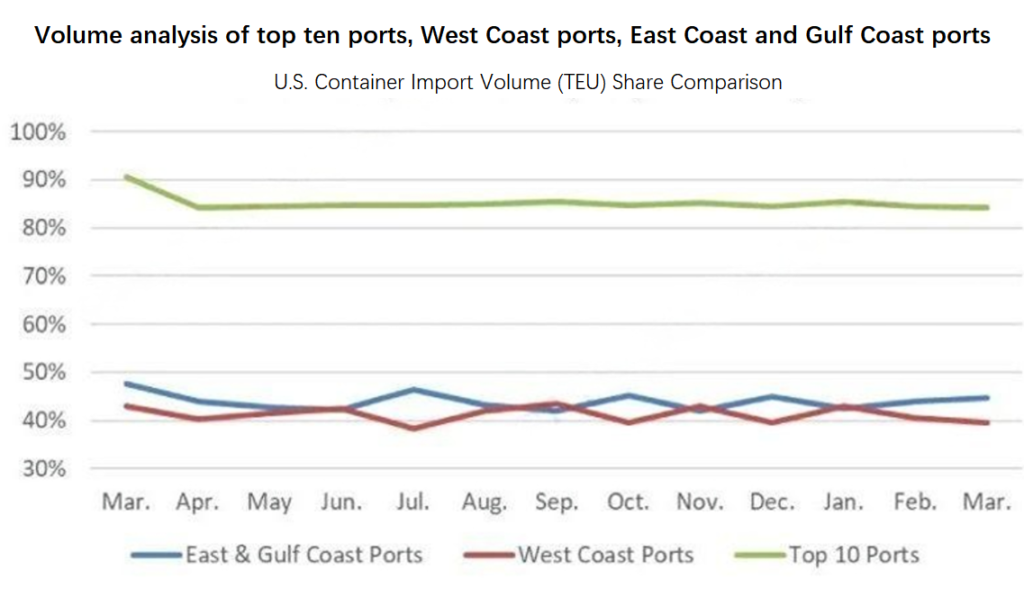
In March 2024, due to other ports remaining relatively stable, the throughput at the Port of Los Angeles decreased by 31,997 TEUs, resulting in a slight decrease in throughput on the West Coast compared to February. Comparing the top five ports on the West Coast to the top five ports on the East Coast and Gulf Coast in March 2024 and February 2024, the market share of the top five ports on the West Coast decreased to 39.5% (a decrease of 2.5%), while the market share of the top five ports on the East Coast and Gulf Coast increased to 44.8% (an increase of 0.8%). Compared to smaller ports, the market share of the top ten ports in March 2024 decreased slightly to 84.2%, a decrease of 0.3% compared to February 2024 (see chart above).
PART3 – IN MARCH, CONTINUED IMPROVEMENT IN US PORT DELAYS
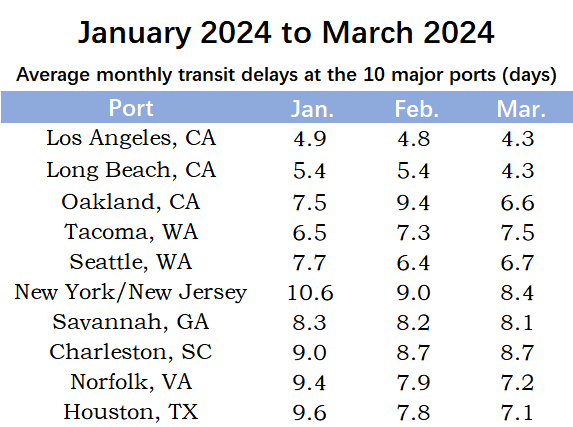
In March 2024, apart from slight increases in average delay times at the Port of Tacoma and the Port of Seattle compared to February, delays at almost all major ports continued to improve (see chart above). The Port of Oakland saw the largest decrease in delays (2.8 days), followed by the Port of Long Beach (1.1 days).
PART4 – IN MARCH, TRADE ROUTES CONTINUE UNAFFECTED BY PANAMA DROUGHT AND MIDDLE EAST CONFLICT
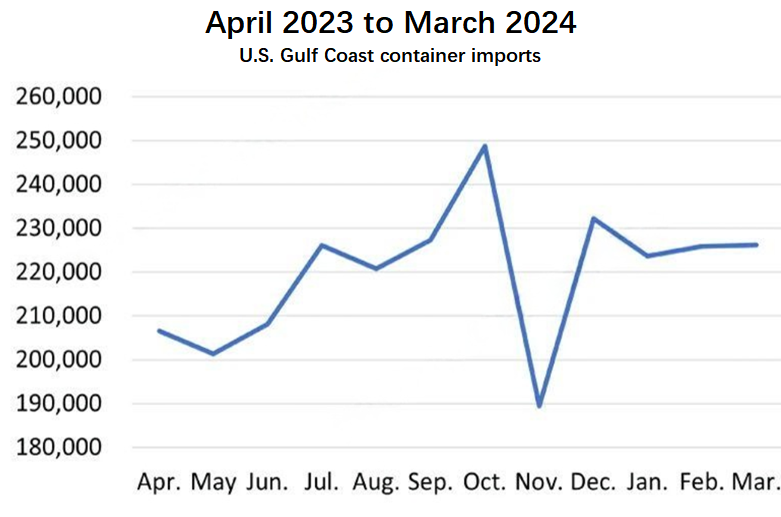
Due to ongoing drought affecting traffic flows, there was no change in the situation at the Panama Canal. In March 2024, the number of transit slots slightly increased to 27, up from 5 in December 2023, but still well below the normal operating level of 36 slots. Attacks by Houthi rebels on Red Sea shipping continued to divert goods traditionally transported through the Suez Canal. The rebels threatened more attacks on shipping lanes in the Indian Ocean. Despite the ongoing strain on capacity at the Panama Canal, volumes at ports along the Gulf Coast remained stable (see chart above). Compared to February 2024, container imports to Gulf Coast ports in March 2024 remained virtually unchanged, increasing by only 0.2% to 226,215 TEUs. The stability of volumes at ports on the East Coast and Gulf Coast also indicates that port transit times remain unchanged.


